Tracking Fatigue Signals: How Recovery Gaps Shape Over/Under Markets in Crowded Fixture Lists
Written by Lars Schmitt · May 17, 2026
Tracking Fatigue Signals: How Recovery Gaps Shape Over/Under Markets in Crowded Fixture Lists
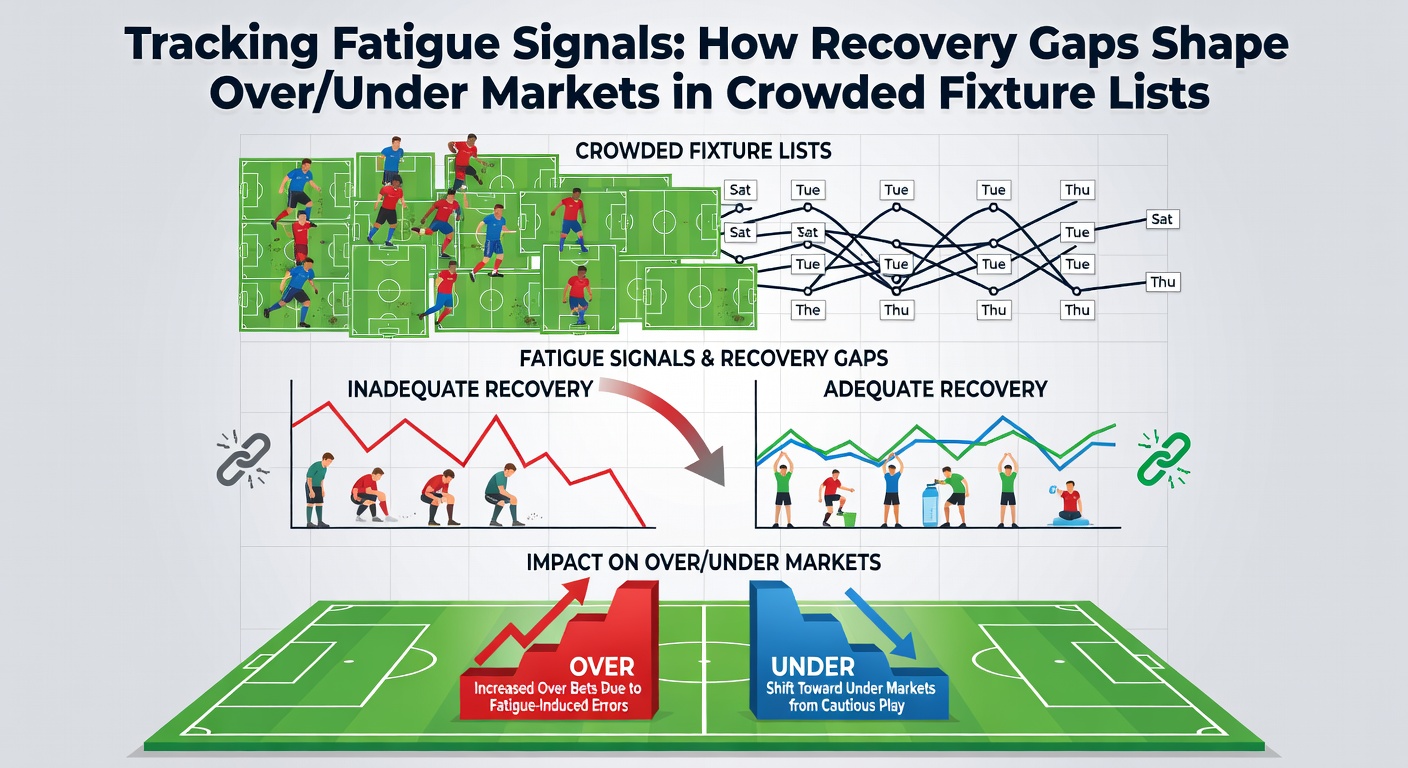
Fixture congestion creates measurable recovery gaps that alter goal patterns, and analysts track these intervals to refine over/under positions across domestic leagues and European competitions. Teams often face multiple matches within short windows during winter months and cup runs, which compresses preparation time and influences total goals in predictable directions according to performance databases maintained by sports science groups.
Defining Recovery Gaps in Modern Schedules
Recovery gaps represent the days between competitive fixtures, and data from major leagues show that intervals under four full days correlate with reduced high-intensity running outputs tracked via GPS systems. Researchers at institutions such as the Norwegian School of Sport Sciences have documented how muscle glycogen replenishment lags when rest periods shorten, leading to slower transitions and fewer open-play sequences that produce goals. Crowded calendars in leagues like the Bundesliga or Serie A amplify these effects because midweek commitments overlap with weekend rounds, creating clusters where average recovery drops below optimal thresholds established in longitudinal studies.
Coaches adjust lineups during these stretches by rotating key players, yet statistical models reveal that collective team output still declines in metrics such as shots on target and expected goals when cumulative fatigue accumulates over three or more tight turnarounds. Observers note that these patterns appear consistently across multiple seasons rather than as isolated anomalies, providing a foundation for market analysis focused on totals rather than individual match winners.
How Fatigue Metrics Translate to Goal Totals
Performance tracking platforms compile data on distance covered, sprint counts, and heart-rate recovery to flag elevated fatigue signals before matches, and these indicators frequently precede lower-scoring outcomes. When squads operate with recovery gaps of 72 hours or fewer, league-wide averages for goals per game dip by measurable margins compared to standard seven-day cycles, according to aggregated figures released by European club competition organizers. This shift tilts over/under markets toward unders because fewer clear chances develop and defensive structures hold longer under reduced physical freshness.
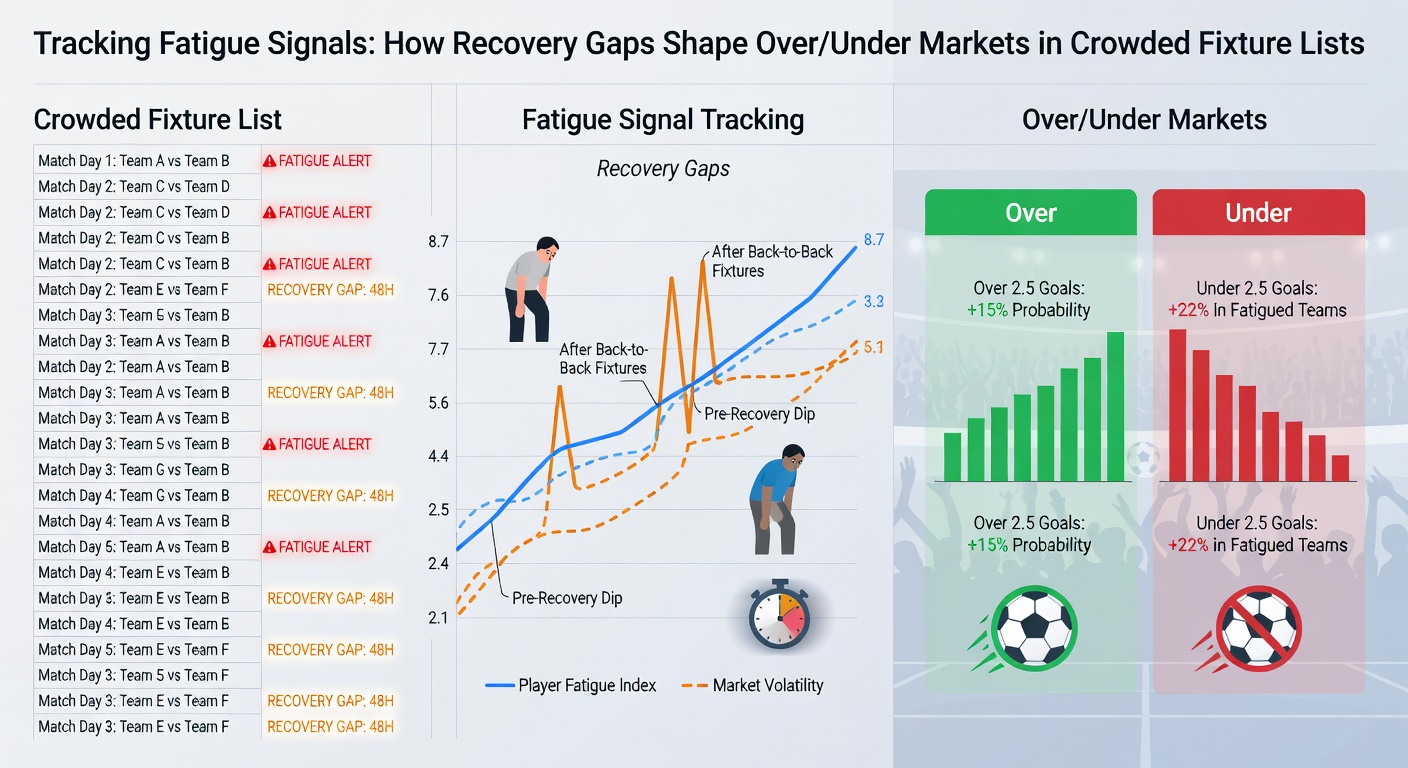
Yet not every congested period produces identical results, because home advantage and tactical adjustments can offset some fatigue effects in specific fixtures. Analysts cross-reference recovery data with historical totals from comparable situations, such as post-international breaks or holiday fixture piles, to isolate where unders hold stronger value. Teams that maintain deeper squads often limit the drop-off, whereas those relying on core starters show sharper declines in second-half goal contributions once fatigue compounds.
Market Implications Across Crowded Periods
Betting markets adjust lines slowly when recovery gaps widen, which creates windows where totals prices lag behind emerging performance trends. Data providers now supply public dashboards that highlight teams with the shortest average rest before upcoming rounds, allowing patterns in over/under settlement rates to surface more clearly. In one extended run during the 2024-25 campaign, several Premier League clubs navigated five matches in 15 days, and totals settled under the posted line in a majority of those contests per match reports compiled by league statisticians.
International tournaments scheduled for early summer introduce additional variables ahead of the following domestic season, and preparatory windows in May 2026 will determine baseline freshness levels before pre-season tours begin. Clubs that secure adequate downtime after final fixtures tend to post higher goal outputs in opening weeks, while those with abbreviated breaks carry residual effects that suppress early totals. Market participants monitor training-ground reports and load-management announcements to anticipate which sides enter new campaigns with larger recovery buffers.
Practical Tracking Methods Used by Analysts
Specialized software aggregates fixture lists, travel distances, and player workload metrics to generate fatigue scores updated after each round, and these scores feed directly into totals projections. Professional syndicates combine such outputs with video review of pressing intensity and set-piece execution rates, since fatigued units concede fewer penalties yet also generate fewer attacking transitions. Academic reviews published through outlets such as the Journal of Science and Medicine in Sport confirm that multi-match clusters elevate error rates in final-third decision-making, further constraining goal volume.
Regional variations matter because weather and pitch conditions interact with fatigue, and analysts in northern European leagues record sharper drops in open-play goals during winter congestion compared with southern counterparts. Cross-referencing these environmental factors with rest data refines the edge when markets price totals uniformly across a slate of fixtures.
Conclusion
Recovery gaps embedded in crowded fixture lists produce repeatable shifts in goal frequency that reshape over/under markets, and systematic tracking of fatigue signals supplies objective inputs for those evaluating totals positions. Continued refinement of workload monitoring tools and expanded data partnerships between leagues and research bodies will likely sharpen these correlations in seasons ahead, offering clearer signals amid increasingly dense calendars.