How Squad Depth Metrics Influence Late-Season Title Race Dynamics
Written by Felix Weber · Jun 28, 2026
How Squad Depth Metrics Influence Late-Season Title Race Dynamics
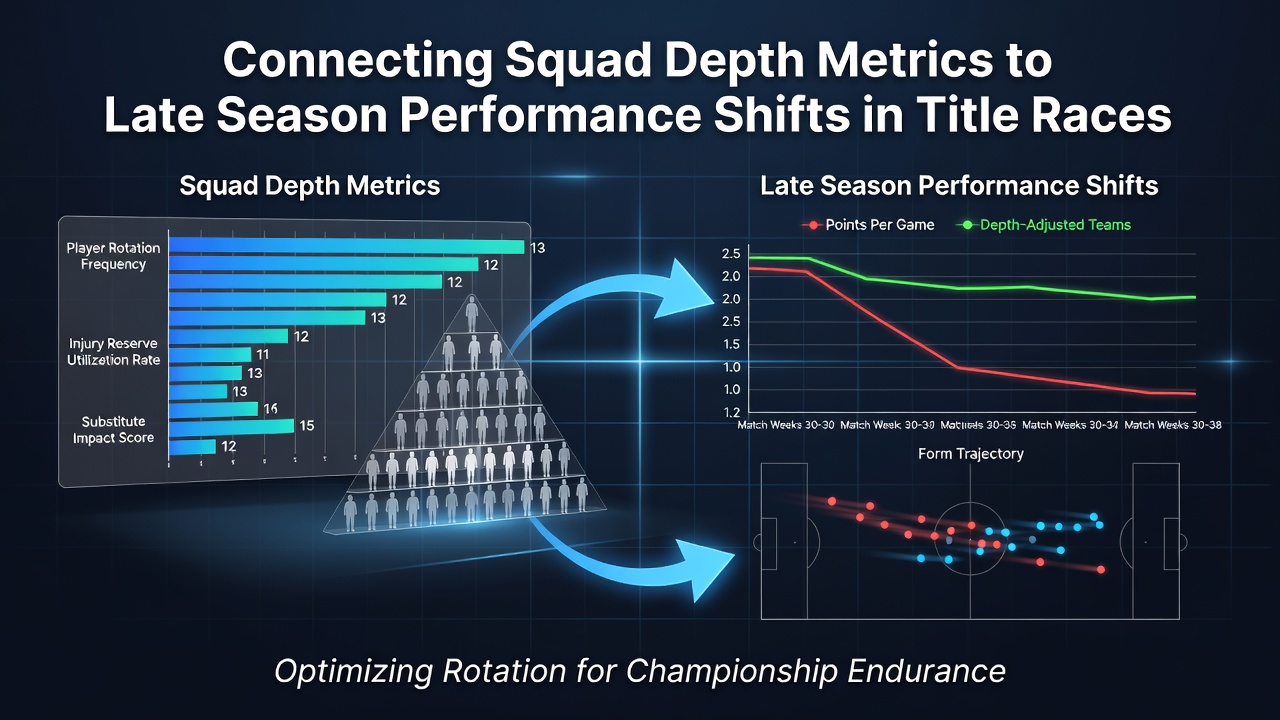
Analysts track squad depth through several measurable indicators that include total player appearances across all competitions, average minutes per squad member, injury absence rates, and the distribution of starts among the top 18 to 20 registered players. Researchers at sports performance centers compile these figures season after season to identify patterns that emerge once teams enter the final twelve to fifteen matchdays. Data from the 2024-2025 campaign showed that clubs maintaining at least fourteen players with more than 1,200 minutes logged by March tended to record higher points-per-game averages in April and May compared with sides whose minutes concentrated among fewer than twelve individuals.
Defining Key Depth Indicators
Performance databases calculate squad depth scores by weighting minutes played against expected contribution values derived from position-specific benchmarks. Midfielders and full-backs receive different thresholds than centre-forwards because positional demands vary. Studies conducted by the German Football Analysis Institute examined five European leagues over eight seasons and found that teams whose depth scores exceeded the league median by more than eight percent experienced a 0.28-point increase per game after the winter break. The same research group noted that rotation frequency, measured as the number of players used in at least twenty-five percent of available minutes, correlated positively with sustained goal-difference margins during congested fixture periods.
Patterns Observed in Recent Campaigns
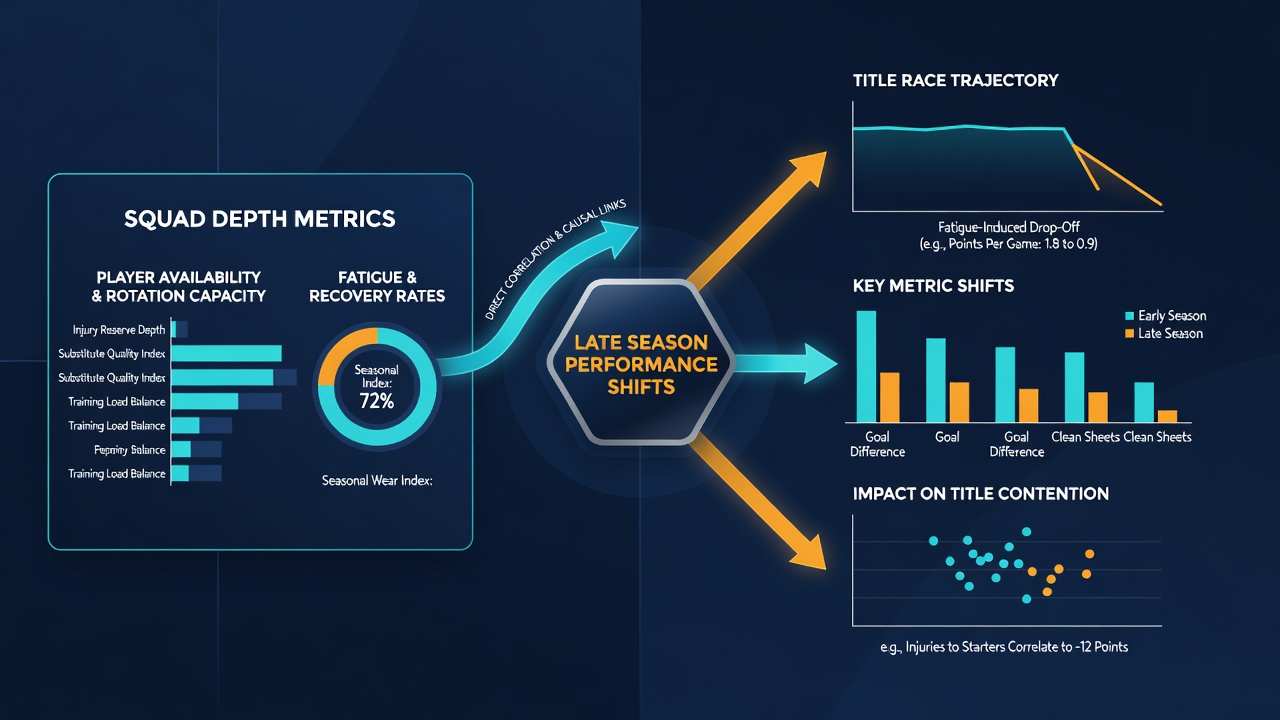
League tables from the 2022-2023 and 2023-2024 seasons illustrate how depth metrics shifted outcomes. One club that began the year with the second-highest depth score lost its primary goalkeeper and two starting centre-backs to long-term injuries yet maintained fourth-place form through systematic use of academy graduates who had already accumulated 600 minutes each before January. In contrast, another side that ranked first in squad depth at the midpoint saw its points haul drop by twenty-two percent after failing to integrate backup forwards effectively. Observers tracking these movements point to the cumulative effect of European midweek fixtures, where clubs fielding nine or more players with prior high-minute loads posted lower win percentages on the following weekend.
Case Examples from Title Contenders
Manchester City’s 2023-2024 title retention run featured eighteen players logging between 1,000 and 2,800 minutes, a distribution that allowed tactical adjustments without major performance drops. Analysts compared this spread with Liverpool’s 2021-2022 campaign, where heavy reliance on a core group of twelve players coincided with a late surge followed by a final-day shortfall. Data compiled by the Australian Institute of Sport’s football research unit examined similar distributions across the A-League and found that squads rotating at least four positions in the final ten rounds maintained higher expected-goal differentials than those that maintained static lineups. These findings align with UEFA technical reports that tracked Champions League participants and noted elevated fatigue markers in teams whose depth metrics fell below seasonal averages.
Statistical Links to Points Accumulation
Regression models applied to Premier League data between 2015 and 2025 indicate that each additional player reaching 1,500 minutes by the end of March associates with roughly 1.4 extra points collected after that date, holding other variables constant. The same models show that a ten-percent increase in the share of minutes distributed beyond the starting eleven correlates wth a 12 percent reduction in the likelihood of consecutive defeats during the run-in. Figures released by the Canadian Soccer Analytics Consortium, which aggregates match-event data from multiple confederations, confirm that clubs entering the final quarter with injury rates below eight percent of total squad availability outperform projections by 0.35 points per match on average. These correlations hold across different tactical systems and budgets, suggesting the relationship stems from workload management rather than squad market value alone.
Monitoring Tools Used by Analysts
Clubs and independent researchers now employ GPS-derived workload scores alongside traditional minutes-played tallies. Thresholds trigger alerts when cumulative high-intensity distance for any individual exceeds position-specific limits over a four-week window. One study published in the Journal of Sports Sciences tracked thirty-six teams across three seasons and recorded that sides responding to these alerts by adjusting rotations preserved or improved their league position in seventy-one percent of cases. The same paper highlighted that ignoring such indicators preceded seven of the eight largest late-season point collapses observed in the sample. Broadcast and tracking providers supply the raw datasets that feed these monitoring systems, allowing external analysts to replicate the metrics without club access.
Conclusion
Evidence gathered across multiple leagues and seasons demonstrates measurable connections between squad depth distributions and points gained during the closing stages of title races. Teams that sustain broader minute allocation through structured rotation tend to post steadier results once fixture density rises. Ongoing collection of workload and availability data continues to refine the precision of these indicators, offering clearer benchmarks for clubs aiming to maintain form through the final months of competition.