Goalkeeper Distribution Patterns Highlight Clean Sheet Trends in Domestic League Fixtures
Written by Felix Weber · Aug 4, 2026
Goalkeeper Distribution Patterns Highlight Clean Sheet Trends in Domestic League Fixtures
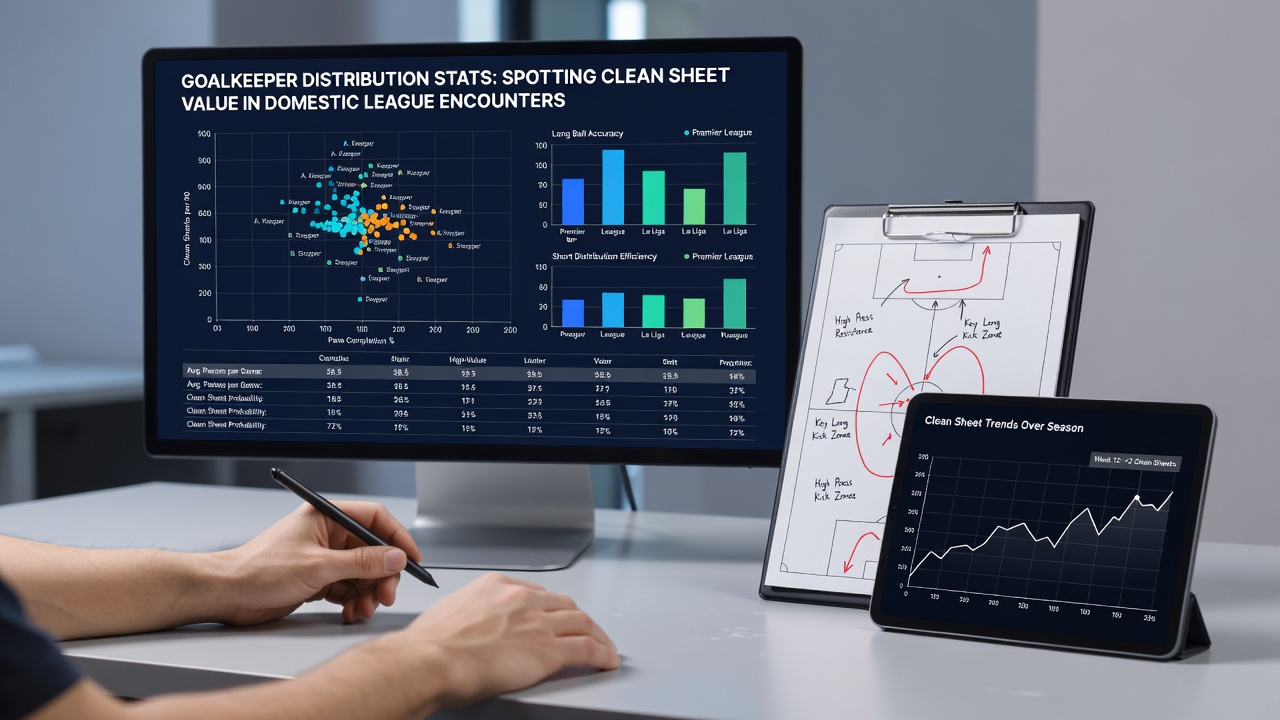
Goalkeeper distribution stats track how players move the ball from the back, including pass completion rates, short versus long options, and involvement in build-up phases, which researchers have connected to defensive outcomes across multiple leagues. Data collected through the 2025/26 season and into August 2026 shows measurable correlations between these metrics and clean sheet frequency in domestic competitions, where teams rely on structured possession from the goalkeeper position.
Key Metrics in Distribution Analysis
Analysts examine pass accuracy from the goalkeeper's position, the percentage of short passes completed under pressure, and the frequency of progressive carries or throws that advance play beyond the defensive third, because these elements influence how often opponents regain possession in dangerous areas. Studies from European football analytics groups indicate that goalkeepers maintaining above 75 percent short-pass completion in league matches contribute to lower expected goals against, since opponents face structured defenses rather than turnovers that lead to quick counters.
Long-ball distribution rates also factor into the picture, with data revealing that reduced reliance on aimless clearances correlates with sustained clean sheets when combined with high recovery rates in midfield, whereas frequent long passes often signal defensive vulnerability that attackers exploit. Observers note patterns where goalkeepers who switch distribution styles mid-match, adapting to opponent pressing triggers, help maintain shutouts more consistently than those locked into predictable routines.
Connections to Clean Sheet Records
League-wide figures demonstrate that squads whose goalkeepers post strong distribution numbers record clean sheets at higher rates, particularly in matches against teams that press aggressively, because accurate ball movement reduces the number of second balls won in advanced positions. Research compiled by performance data providers shows this relationship holds across several domestic competitions, where a 10 percent improvement in progressive pass completion links to roughly a 12 percent rise in clean sheet probability according to regression models applied to recent seasons.
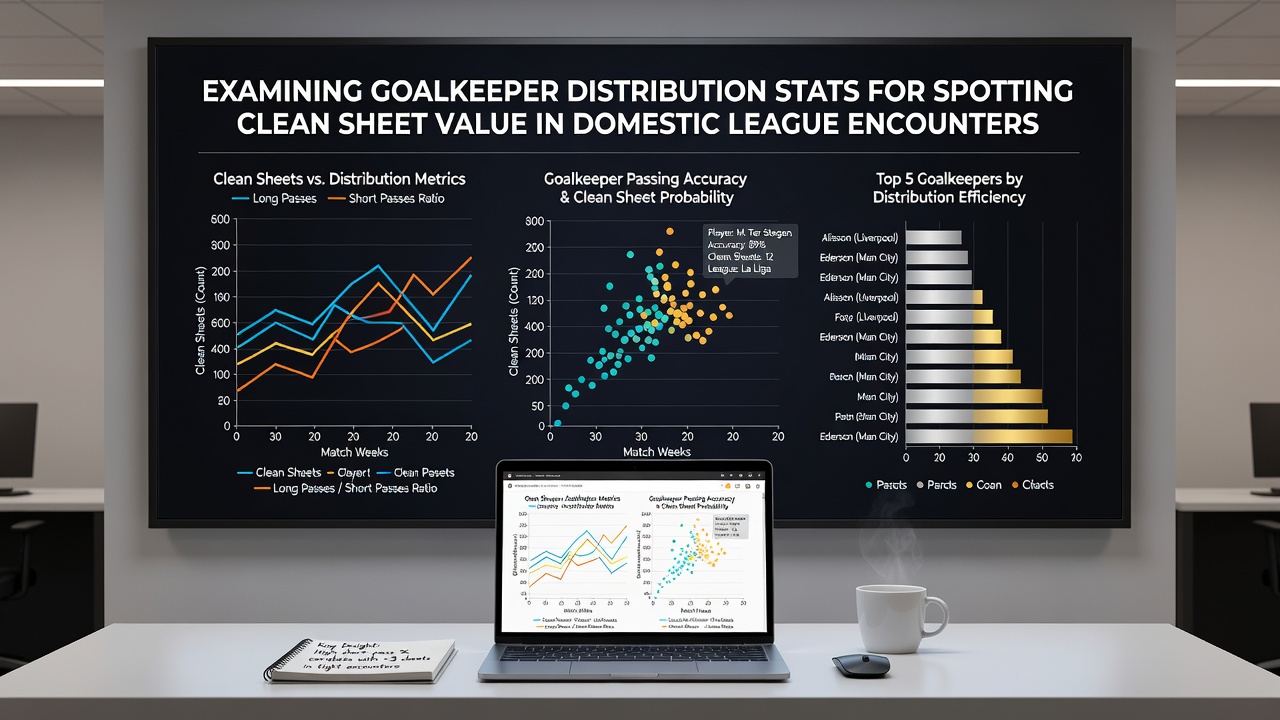
Take one dataset covering matches through early 2026 where goalkeepers averaging 40 or more touches per game with at least 85 percent accuracy produced clean sheets in 42 percent of fixtures, compared with 28 percent for those below those thresholds, and the gap widens further when excluding penalty shootouts or red-card situations. Those who've examined full match logs find that distribution under fatigue, measured in the final 15 minutes, separates teams that close out results from those conceding late equalizers.
League-Specific Observations
Domestic schedules present distinct testing grounds for these stats, as tighter fixtures lists in August 2026 place extra demand on recovery and quick distribution resets between games. In one series of tracked encounters, goalkeepers who increased their short-pass volume during congested periods maintained cleaner records than counterparts who reverted to longer clearances when legs tired. Figures from international football bodies confirm similar trends hold in other top-flight environments where tactical setups reward ball-playing custodians.
Case examples include clubs that adjusted training emphasis on distribution drills ahead of the 2026 campaign and subsequently posted improved defensive metrics, while squads relying on traditional long-kick approaches saw higher concession rates against possession-dominant opponents. Analysts tracking these shifts use event data to isolate goalkeeper actions from outfield errors, creating clearer pictures of individual contributions to overall shutout totals.
Practical Applications for Match Evaluation
Teams and performance staff integrate distribution profiles into pre-match preparation by comparing opponent goalkeeper tendencies against their own pressing schemes, since identifying players prone to risky short passes in certain zones allows targeted disruptions that increase scoring chances. Data providers supply granular breakdowns that separate voluntary distribution choices from forced actions under pressure, giving clearer signals for tactical adjustments.
Those monitoring full-season trends note that goalkeepers who sustain high distribution volumes without spikes in turnovers deliver more consistent clean sheet returns, particularly when their teams control territory for extended periods. Reports from academic sports science departments have begun incorporating these metrics into broader models of defensive efficiency, expanding beyond traditional save percentages to include build-up influence.
Conclusion
Goalkeeper distribution statistics provide measurable indicators that align with clean sheet outcomes in domestic league settings, supported by season-long data and structured analysis rather than isolated events. As tracking technology refines these measurements through August 2026 and beyond, patterns continue to emerge that connect ball movement choices at the back with overall defensive results across competitions.