Distance Dilemmas: Mapping Team Travel Burdens Against Performance Shifts for Strategic Wagers
Written by Felix Weber · Jun 25, 2026
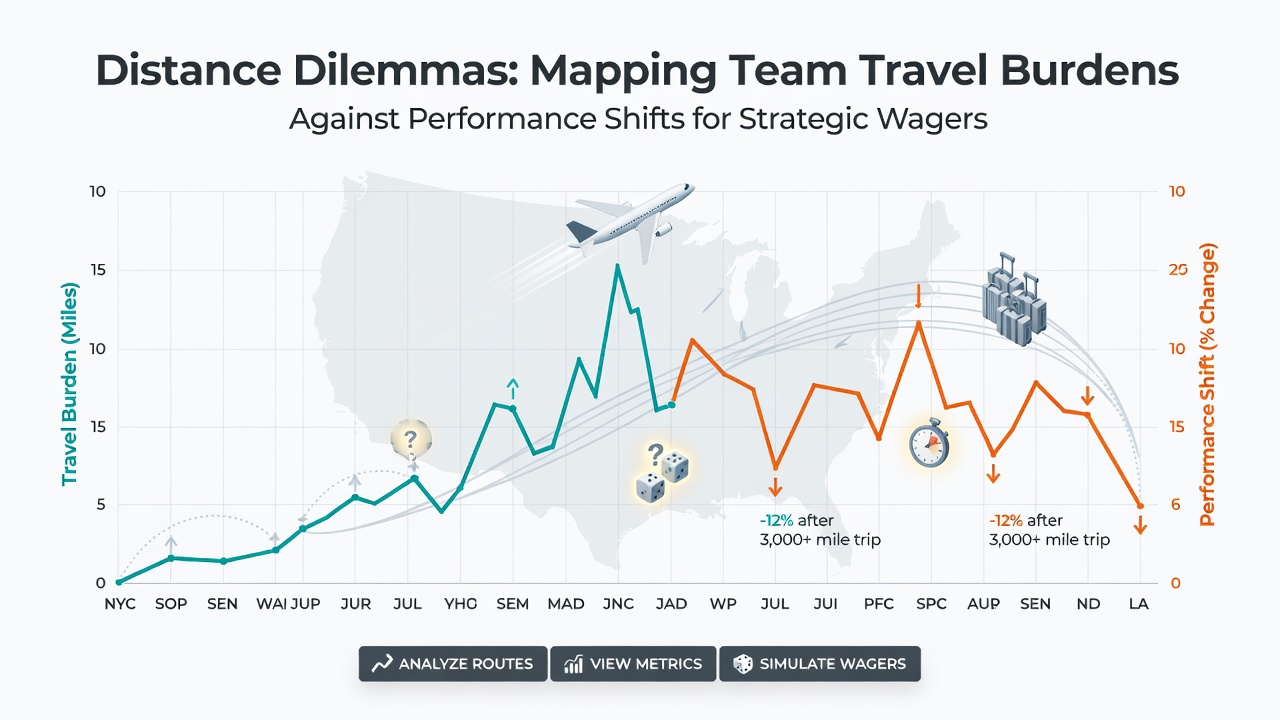
Distance Dilemmas: Mapping Team Travel Burdens Against Performance Shifts for Strategic Wagers
Teams in top European competitions face increasing travel demands as fixture calendars expand, and analysts track how these distances correlate with shifts in match outcomes. Data from domestic leagues and continental tournaments shows patterns where longer journeys precede measurable drops in key performance indicators such as distance covered at high intensity, passing accuracy, and goal conversion rates. Observers note that these patterns hold across multiple seasons, with variations depending on flight times, time zone changes, and recovery windows between matches.
Travel Patterns in Contemporary Leagues
Premier League clubs logged an average of 12,000 kilometers per team during the 2025-2026 campaign according to fixture tracking services, while clubs participating in midweek European ties exceeded 20,000 kilometers in several cases. Researchers at the University of Queensland examined similar schedules in the A-League and found that trips exceeding 1,500 kilometers correlated with a 7 percent reduction in total distance covered during the subsequent home fixture. Those figures align with observations from North American leagues where cross-country flights produce comparable effects on player workload metrics.
Performance Metrics and Recovery Data
Performance tracking systems record declines in sprint frequency and defensive duels won after extended travel, yet some teams demonstrate resilience when they possess deeper squads or longer rest periods. A 2024 report published in the International Journal of Sports Physiology and Performance documented that matches following transcontinental flights showed elevated rates of late-game concessions across sampled competitions. The study tracked heart rate variability and sleep data from wearable devices, revealing slower return to baseline readiness levels when recovery time fell below 72 hours. Analysts combine these physiological markers with historical result data to identify fixtures where travel burden may shift expected outcomes.
June 2026 schedules include several high-profile international qualifiers that will add further distance for club players returning from national team duties. Scheduling services already flag potential clusters where European-based athletes face back-to-back long-haul returns before domestic rounds resume.
Strategic Mapping for Betting Markets
Betting markets incorporate travel-adjusted models that weigh cumulative kilometers against recent form indicators. Sharp bettors examine subsets of data such as away performance after European nights or home results following domestic long-haul trips. One established approach involves layering travel distance thresholds onto handicap markets, where teams returning from distant fixtures show elevated underdog probabilities in certain statistical bands.
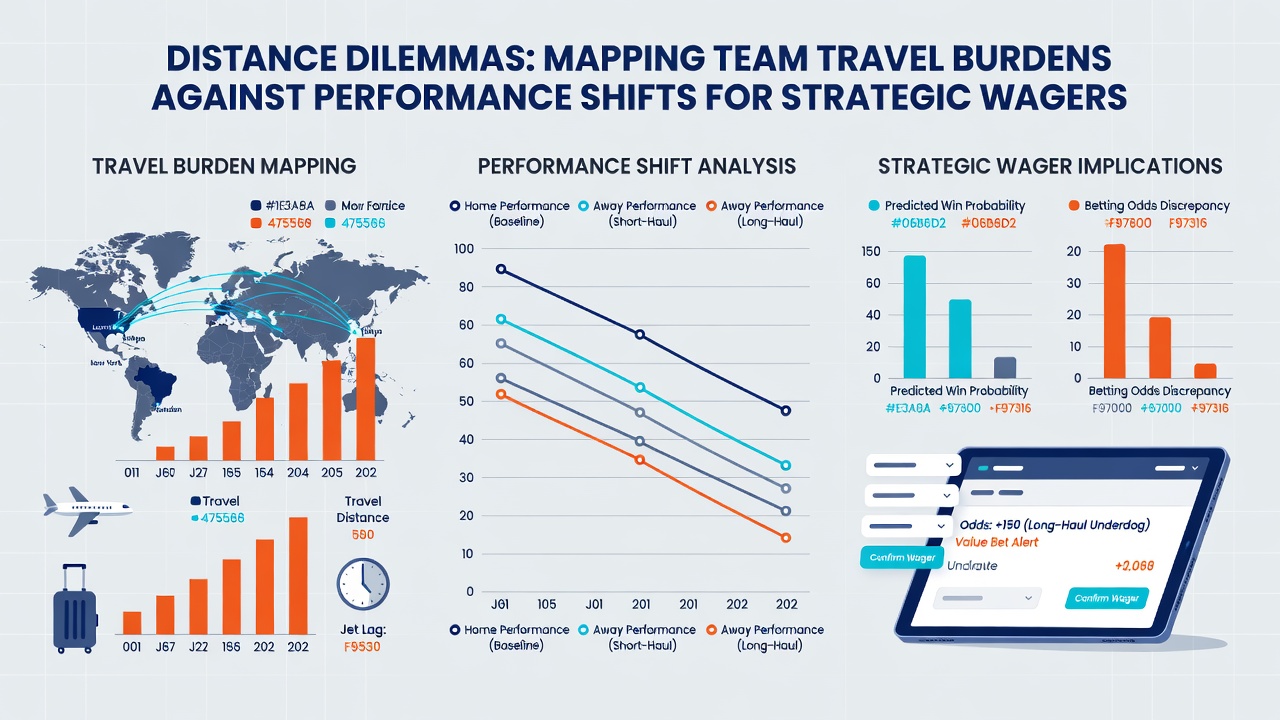
Canadian Soccer Association data releases from early 2026 provide additional benchmarks for North American clubs transitioning between CONCACAF competitions and domestic play, showing parallel trends in recovery timelines. Market participants cross-reference these datasets with live odds movements to identify value when bookmakers apply uniform pricing without full travel context.
Case Examples from Recent Campaigns
During the 2025 Champions League group stage, multiple clubs recorded lower expected goal tallies in domestic matches immediately after lengthy European travel, according to aggregated event data. Observers documented instances where teams averaged 1.8 fewer high-intensity runs per player in the first half of weekend fixtures following Wednesday night away legs. Such patterns repeat across different leagues and seasons, allowing systematic comparison rather than isolated anecdotes. Those who maintain longitudinal databases note that the effect size varies by squad rotation depth and fixture congestion windows.
Integrating External Research Sources
Academic reviews from the International Journal of Sports Physiology and Performance supply standardized protocols for measuring travel fatigue, while reports from the Australian Institute of Sport offer comparative insights from southern hemisphere schedules that mirror European congestion periods. Bettors integrate these external benchmarks into proprietary models that adjust probability estimates for specific matchups.
Conclusion
Distance tracking combined with performance analytics supplies a growing layer of context for those constructing wagers around schedule realities. As calendars remain dense through mid-2026, continued collection of travel and workload data will refine these mappings further, enabling more precise alignment between observed burdens and market pricing across multiple competitions.